User-Centric Metrics are
Linked to Business Growth
WHY DECISION MAKERS SHOULD FIX CORE WEB VITALS
The Challenge
Sales, marketing, HR, and finance departments all have established metrics that reflect the current status of the business, how it’s progressing, and where to invest to achieve business goals. But because user experience is a relatively immature practice, it has been difficult to prove how UX supports business strategy and contributes to business objectives—until now. Core Web Vitals help businesses quantify user experiences and correlate them with key business metrics. In fact, business leaders who took Google’s new update seriously are already seeing positive results for their users and their business.
Our Solution
Dymic’s path to improving website performance can vary from site to site depending on the CMS, design complexity, and where businesses are in their performance journey. In some cases, there will be low-hanging fruit making it relatively easy to achieve meaningful Core Web Vitals results; others will have more challenging issues that require complex solutions. But in either case, decision makers should consider this a long term, business growth investment. Because one thing is certain—delivering a fast and seamless web experience directly affects crucial business metrics: conversion rates, marketing return on investment (ROI), retention (loyalty), brand perception, customer lifetime value (CLVT), search rankings (SEO), sales revenue, and more.
40% of people abandon a website that
takes more than 3 seconds to load
Google's UX Metrics are Evolving
Core Web Vitals are a great starting point for analyzing web page performance. But they are just a subset of metrics that evolved from the Web Vitals initiative created by Google. When you combine CWVs with the other metrics, you get a more comprehensive picture of web performance. In addition to Core Web Vitals, we recommend using the following 12 page performance metrics, which are selected based on two criteria:
A. The impact the metric can have on Google search rankings
B. Whether the metric can be realistically optimized by web developers
- Total Blocking Time
- First Contenful Paint
- Time to Interactive
- Speed Index
- Unused CSS Rules
- Unused Javascript (JS)
- Next-gen Images
- Optimized Images
- Responsive Images
- DOM Size
- Render Blocking Resources
- Total Byte Weight
Consider the following page speed and user experience statistics:
Slow-loading websites cost their owners $2.6 billion in losses each year
Good UX Design can raise your website’s conversion rate by up to 400%
Bounce rates increase by 90% when the load time goes from 1 to 5 seconds
Google's UX Metrics are Evolving
Core Web Vitals are a great starting point for analyzing web page performance. But they are just a subset of metrics that evolved from the Web Vitals initiative created by Google. When you combine CWVs with the other metrics, you get a more comprehensive picture of web performance. In addition to Core Web Vitals, we recommend using the following 12 page performance metrics, which are selected based on two criteria:
A. The impact the metric can have on Google search rankings
B. Whether the metric can be realistically optimized by web developers
- Total Blocking Time
- First Contenful Paint
- Time to Interactive
- Speed Index
- Unused CSS Rules
- Unused Javascript (JS)
- Next-gen Images
- Optimized Images
- Responsive Images
- DOM Size
- Render Blocking Resources
- Total Byte Weight
Consider the following page speed and user experience statistics:
Slow-loading websites cost their owners
$2.6 billion in losses each year
Good UX Design can raise your website’s conversion rate by up to 400%
Bounce rates increase by 90% when the
load time goes from 1 to 5 seconds
QUANTIFYING USER EXPERIENCE
Google's New
Page Experience Signals
Optimizing for user experience has always been important, but now website owners are being pressured to fix Core Web Vitals—the new addition to Google’s ranking algorithm. According to Google, the purpose of this initiative is “to provide unified guidance for quality signals that are essential to delivering a great user experience on the web.” As explained in our Core Web Vitals eBook, the update combines three new signals with existing page experience signals. These valuable metrics can help business owners, marketers, and developers quantify the user experience and identify opportunities to improve page speed, conversion rates, and now, search rankings. Here is a summary with Google’s new scoring system:

LOADING EXPERIENCE
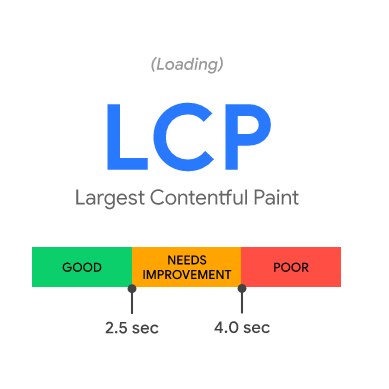
Largest Contentful Paint (LCP)
Largest Contentful Paint (LCP) is a technical term for the render time of the largest text or image block on a webpage—a fast LCP helps ensure the page is useful because it decreases the time it takes for the content to populate on a user’s device.
Google rates LCP with three scores:
- Good: 2.5s and under
- Needs Improvement: 2.5s–4s
- Poor: 4s and over

INTERACTIVE EXPERIENCE
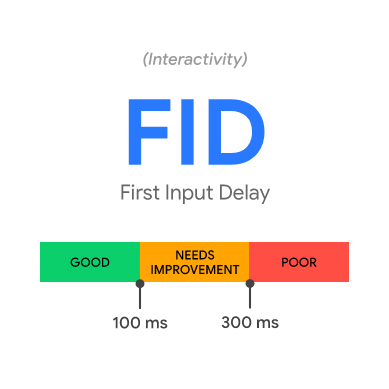
First Input Delay (FID)
First Input Delay (FID) is a metric for measuring how fast a user’s interactions are processed—a low FID helps ensure the page is usable because it reduces the time it takes a website to register a user’s interaction (the click) and process the request.
Google rates FID with three scores:
- Good: 100ms and under
- Needs Improvement: 100–300ms
- Poor: 300ms and over

STABILITY EXPERIENCE
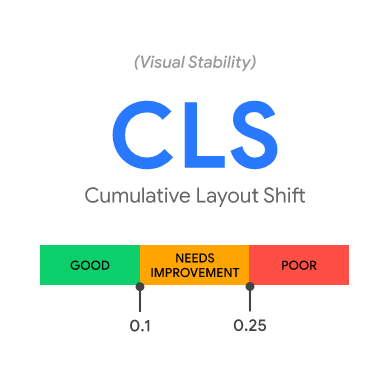
Cumulative Layout Shift (CLS)
Cumulative Layout Shift (CLS) is a metric for measuring the movement of webpage elements (as they load)—a low CLS ensures the page is predictable by reducing content jumps and skips, so the link clicked is what you get (not the ad above it).
Google rates CLS with three scores:
- Good: 0.1s and under
- Needs Improvement: 0.1s–0.25s
- Poor: 0.25s and over
QUANTIFYING
USER EXPERIENCE
Google's New Page Experience Signals
Optimizing for user experience has always been important, but now website owners are being pressured to fix Core Web Vitals—the new addition to Google’s ranking algorithm. According to Google, the purpose of this initiative is “to provide unified guidance for quality signals that are essential to delivering a great user experience on the web.” As explained in our Core Web Vitals eBook, the update combines three new signals with existing page experience signals. These valuable metrics can help business owners, marketers, and developers quantify the user experience and identify opportunities to improve page speed, conversion rates, and now, search rankings. Here is a summary with Google’s new scoring system:

LOADING EXPERIENCE
Largest Contentful Paint (LCP)
Largest Contentful Paint (LCP) is a technical term for the render time of the largest text or image block on a webpage—a fast LCP helps ensure the page is useful because it decreases the time it takes for the content to populate on a user’s device.
Google rates LCP with three scores:
- Good: 2.5s and under
- Needs Improvement: 2.5s–4s
- Poor: 4s and over

INTERACTIVE EXPERIENCE
First Input Delay (FID)
First Input Delay (FID) is a metric for measuring how fast a user’s interactions are processed—a low FID helps ensure the page is usable because it reduces the time it takes a website to register a user’s interaction (the click) and process the request.
Google rates FID with three scores:
- Good: 100ms and under
- Needs Improvement: 100–300ms
- Poor: 300ms and over

STABILITY EXPERIENCE
Cumulative Layout Shift (CLS)
Cumulative Layout Shift (CLS) is a metric for measuring the movement of webpage elements (as they load)—a low CLS ensures the page is predictable by reducing content jumps and skips, so the link clicked is what you get (not the ad above it).
Google rates CLS with three scores:
- Good: 0.1s and under
- Needs Improvement: 0.1s–0.25s
- Poor: 0.25s and over
Dymic's Website
Optimization Services
SOLVE WEBSITE SPEED PROBLEMS, FIX CORE WEB VITALS ISSUES,
& IMPROVE GOOGLE'S PAGESPEED INSIGHTS SCORES
Improving site speed and efficiency involves a review of your website’s current state, and then implementing technical, web development, and other site speed best practices. Dymic’s highly experienced web development, UX design and SEO teams understand Core Web Vitals, their impact on user experience, and the full spectrum of search engine optimization best practices. There are many optimization techniques in our process; some will make a significant difference, and others might be less impactful. But in the website performance world—every millisecond counts.
Dymic's Website
Optimization Services
SOLVE WEBSITE SPEED PROBLEMS,
FIX CORE WEB VITALS ISSUES,
& IMPROVE GOOGLE'S PAGESPEED INSIGHTS SCORES
Improving site speed and efficiency involves a review of your website’s current state, and then implementing technical, web development, and other site speed best practices. Dymic’s highly experienced web development, UX design and SEO teams understand Core Web Vitals, their impact on user experience, and the full spectrum of search engine optimization best practices. There are many optimization techniques in our process; some will make a significant difference, and others might be less impactful. But in the website performance world—every millisecond counts.
Site/Page Level
Though they may seem similar, page speed is not the same as site speed. Site speed is the average of many pages on a website. But page speed is based on how long a user will have to wait to interact with a page. Every element on a page — HTML code, CSS (the code that styles page elements), JavaScript files, images, videos — affects page speed. Here's a list of some of our site/page level optimizations:
- Image Optimization
- Video Optimization
- Critical Path CSS Setup
- CSS Optimization
- Javascript Optimization
- Lazy Loading Configuration
- Page Caching
- Plugin Optimization
- Minimize HTTP(S) Requests
- Google Tag Manager Implementation
- Defer or Async Scripts
Server Level
No matter how many optimizations you make to the code, images, or other elements on the page (site level), the improvement can be restricted if your server is slow. Likewise, if you’re using a slow DNS, it can increase the time it takes for browsers to locate your site. Here's a list of some of our server level optimizations:
- Full Site Backup
- Server Optimization
- Cloudflare CDN Setup
- Browser Caching
- HTTPS Implementation
- Database Optimization
- Hosting Migration (Optional)
- .HTACCESS Optimization
- DNS Record Optimization
- Gzip Compression
- Redirect Optimization
HOW IT WORKS
Check & Fix Your
Website's Core Web Vitals
Dymic’s speed test tool offers both mobile and desktop speed insights based on real-life data from Google Chrome browsers. The test will also tell you how Google scores your site for technical SEO, Accessibility, and Best Practices (trust, safety, UX, etc). Just complete the form and click the submit button to test your website.
- If your site doesn’t score well, schedule your site speed consultation below to get help.
HOW IT WORKS
Check & Fix
Your Website's
Core Web Vitals
Dymic’s speed test tool offers both mobile and desktop speed insights based on real-life data from Google Chrome browsers. The test will also tell you how Google scores your site for technical SEO, Accessibility, and Best Practices (trust, safety, UX, etc). Just complete the form and click the submit button to test your website.
- If your site doesn’t score well, schedule your site speed consultation below to get help.
"*" indicates required fields
Please note: Based on the size of your website, the results can take 30-120 seconds to display on this page.
Please note: Based on the size of your website, the results can take 30-120 seconds to display on this page.
Need Help? Still Have Questions?
Dymic offers three different page speed optimization plans based on your website’s CMS platform, number of web pages, design complexity, and other variables affecting the optimization process. Give us a call or schedule a consultation to learn more about how we can help you get your website loading as fast as possible.
Need Help?
Still Have Questions?
Dymic offers three different page speed optimization plans based on your website’s CMS platform, number of web pages, design complexity, and other variables affecting the optimization process. Give us a call or schedule a consultation to learn more about how we can help you get your website loading as fast as possible.

